
(Given the shift in how I’m managing time now, I’ve scrubbed the ‘week’ parts from the post. Still waiting to hear back with confirmation from Creative Victoria re: the extension, but I’m planning on good news there)
So I spent the last week (and change) looking at logging and analytics for Alexa apps. Once a skill starts being actively used, it’s important to understand how it’s being used. The questions that came to mind as most relevant were:
- who is using my skill?
- for how long?
- how are they using it?
- what’s going wrong?
This post is a brief summary of the areas I looked at to answer those questions.
Lambda Logging
I started with looking at logging inside the Lambda function itself. Looking at the request documentation, there are two very useful pieces of information that are available as part of processing each request, provided in the request envelope:
- the user ID (via the Request object)
- the session ID (via the Session object)
Why are these two pieces of information important?
The user ID identifies a user on an Alexa device uniquely - more finely grained than a device ID alone. The user ID alone is not sensitive information - it’s essentially a very long Base64 string of gibberish, so there are no concerns I’m aware of with logging and storing that info. It’s good to know about individual users because that shows what users are finding interesting if they return to a skill. It also opens the door to user engagement like asking repeat users about a survey poll outside the context of the skill to gather more information. If you can identify repeat users, you can interact with them.
The session ID is important both with and without the user ID in order to track a single period of play. How do users interact with a skill? Is there a typical flow for longer sessions? What seems to make users fall off using the skill? Using a function call at the start and end of each intent handler, this code provided both pieces of information at the start and end fo intent handler execution:
def log_intent_handler_start(handler_input, intent_name=None):
    user_id = handler_input.request_envelope.session.user.user_id
    session_id = handler_input.request_envelope.session.session_id
    if intent_name is None:
        intent_name = request_util.get_intent_name(handler_input)
    message = "{} BEGIN [SESSION_ID {}] [USER_ID: {}]".format(intent_name, session_id, user_id)
    logger.info(message)

def log_intent_handler_end(handler_input, intent_name=None):
    user_id = handler_input.request_envelope.session.user.user_id
    session_id = handler_input.request_envelope.session.session_id
    if intent_name is None:
        intent_name = request_util.get_intent_name(handler_input)
    message = "{} END [SESSION_ID: {}] [USER_ID: {}]".format(intent_name, session_id, user_id)
    logger.info(message)
CloudWatch Insights
From there, I looked at CloudWatch’s capabilities for creating reporting and analytics via Insights. The user experience in the Insights UI is quite pleasant, and its quite straightforward to discover new fields via the parse function, which allows queries to use fields like session ID and user ID which come from application-specific logging. For example, this query shows relative session length for the first 100 session IDs it finds:
fields @timestamp, @message
| filter @message like /SESSION_ID:/
| parse @message "* [SESSION_ID: *] [USER_ID: *]" as textMessage, sessionId, userId
| stats count(*) by sessionId
| display @timestamp, sessionId, textMessage
| limit 100
With Insights it seems pretty straightforward to be able to put together a visualization showing activity measured in users or requests over time. With the time spent with the tool, I couldn’t find an easy way to be able to drill down from a list of session IDs to all log entries for a specific session ID, which would definitely be useful for streamlining investigation of user behaviour. The capability may be in the tool natively, but I haven’t found it yet.
Alexa Developer Console Analytics
From there, investigation looped back to the Alexa Developer Console Analytics dashboard. After first attempting to answer questions manually, I realised the out-of-the-box analytics tab for a skill answers some important questions:
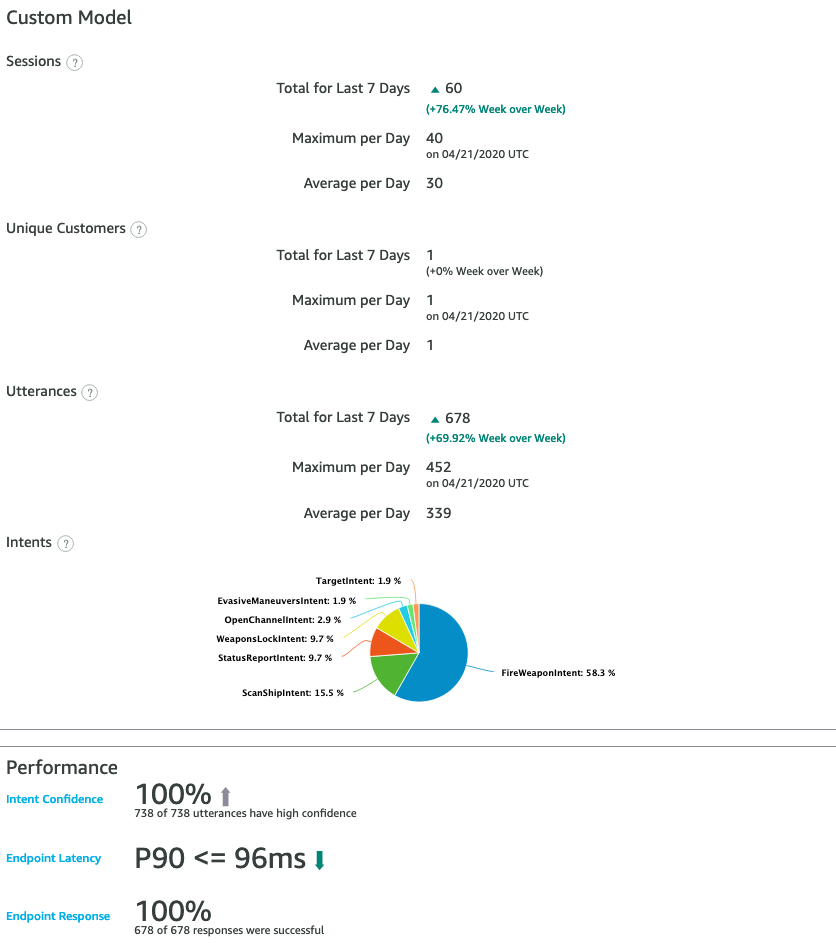
- How often is my skill being used? (Sessions per day)
- How many people are using the skill?
- Which intents are being used? (The Intents pie graph)
- Is my skill understanding users? (Intent Confidence)
- How is my skill performing? (Endpoint latency)
I’d written off this tool initially, but there are some very useful answers given by the analytics page, especially regarding the skill’s understanding of utterances.
Datadog
Investigation then moved out of AWS tools into the third-party Datadog web application. This was for a couple of reasons:
- Visualizations in CloudWatch Insights are limited to line, stacked area and bar charts, limiting representation of information to quantity over time dashboards.
- Queries are charged in CloudWatch Insights based on the volume of data queried. While the charges involved are small, this precludes intensive exploration of data. For more complex experiences, this would make understanding usage patterns more costly.
After configuring Datadog’s AWS integration, log files from all AWS Lambda functions, which effectively means all Alexa skills, could then be automatically ingested to Datadog, incurring a one-time ingestion fee based on volume of data. The app stores the source function generating the log data along with the data itself, allowing queries to search logs for a specific function, or all functions.
Investigation in Datadog was comparatively short due to time constraints - I found Datadog’s ability to define fields by extraction comparatively complicated, attempting to extract out session and user IDs. I’m very keen to revisit its richer visualization capabilities as the complexity of my own skill prototypes evolve.
Where To From Here?
After this exploration, the likely approach to managing analytics going forward is:
- using the standard logging function shown in this post, and enhancing it to be automatically invoked by a request logger and response logger rather than requiring manual invocation.
- using the Alexa Developer Console dashboard and a fallback intent handler to track misunderstood intents in order to improve the user experience.
- using CloudWatch Insights to provide basic metrics on on-boarding and usage
- expanding to Datadog to provide more extensive dashboarding eventually, once a skill moves past a threshold of complexity, in order to understand user behaviour (and segmentation) further.
That’s all for now on logging. On to the next topic!